
The following shows the daily gross return histogram from the strategy since it was launched in June 2020.
Chart 1: Daily Strategy Returns (Jun 2020 - Feb 2022)
Source: OQFM
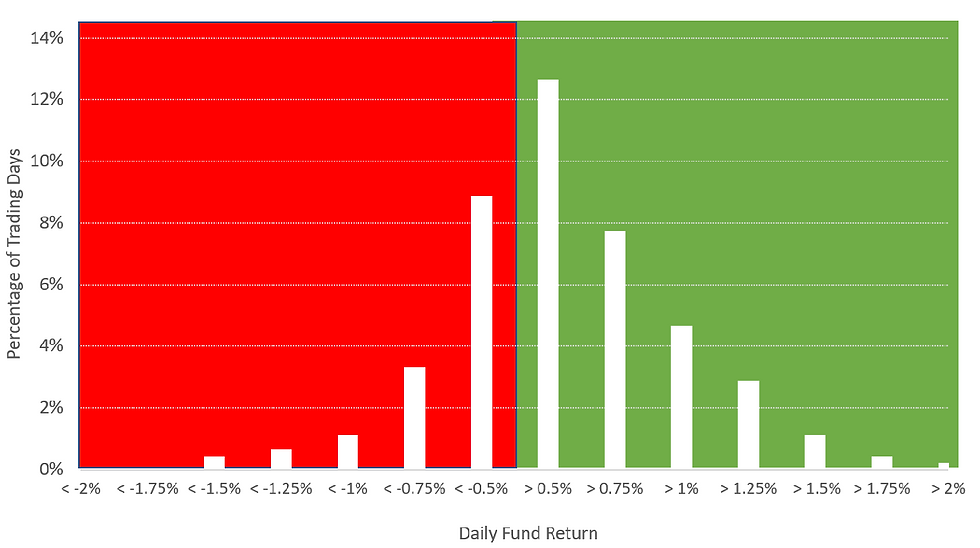
There are two key points to note:
There are very few outliers. In particular, there are very few daily returns less than -1%. This is by design given the strategy is positioned as a relatively low risk offering and, via our systematic investment process and our non-systematic overlay, we focus on reducing tail risks.
The return distribution has a positive skew.
The second point is highly pertinent. The objective of quant factor investing is to skew the odds slightly to the investor’s advantage. This sounds like a rather tame objective, but it is the best that can be achieved. Quant models with really strong predictive power that generate consistently positive outcomes do not exist.
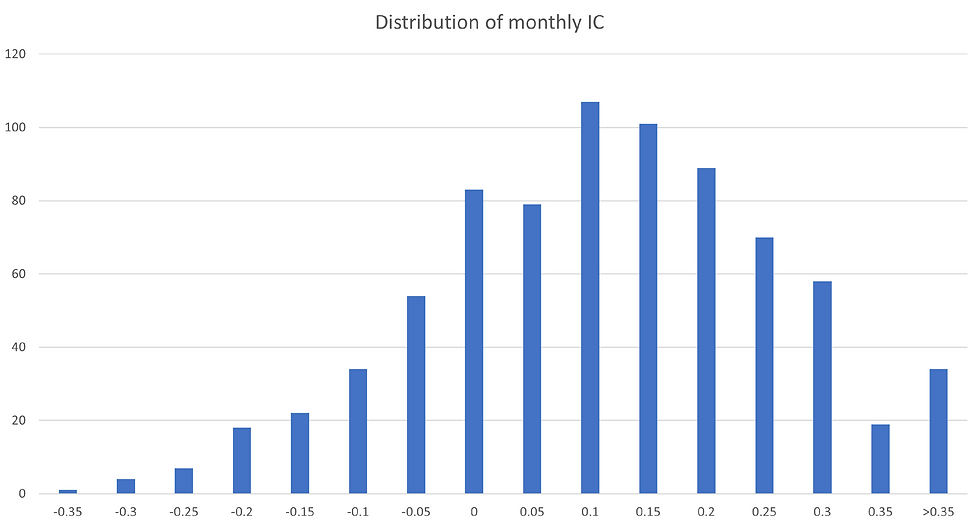
Consider the predictive power of a linear multi-factor quant score that combines value, momentum sentiment factors, and certainty factors. In Asia, these factors have performed relatively strongly, especially compared to the United States. Yet, the average monthly rank IC over the last 20 years for the three key markets in the Fund’s universe – Japan, Hong Kong and Australia - is only 5.6%. However, the monthly rank IC performance histogram does show some desirable properties: there is a positive skew and there are relatively few left tail outliers.
Chart 2: Multi-Factor Quant Monthly Rank IC Histogram
Source: OQFM
Next, consider a hypothetical quant factor that has a 50% success rate. In other words, it is equally likely to succeed as to fail. To illustrate the likely return outcomes, we’ll use a Galton board. Conveniently, I’ve got one on the desk in my study. The board has 3,000 balls and each time I flip it over, it generates a nice normal distribution with a few balls on the far-right side of the distribution. There are 12 layers of pegs on the board, so it is no easy feat to always fall on the right side of the peg. Presumably any ball which does this successfully thinks it’s highly skilled!
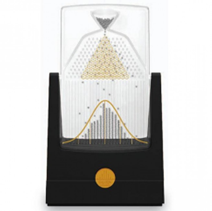
It is important to note that with a 50% success rate (i.e. no skill) and 12 decision points, anyone can be lucky. However, over time (i.e. with enough decision points), the probability of consistently making the right decision diminishes and the equency distribution becomes more tightly grouped around zero (relative to the theoretical maximum and minimum scores).
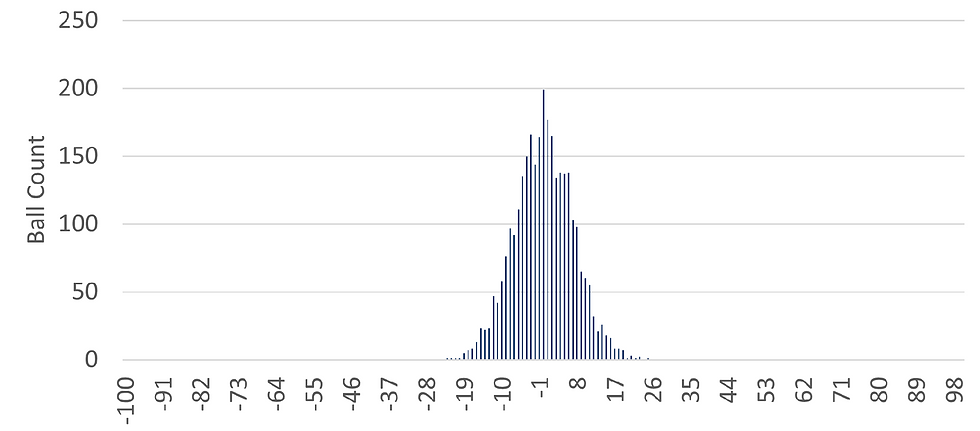
To illustrate: consider our Galton board with 3,000 balls and 12 peg layers, and a hypothetical Galton board with the same number of balls and 200 peg layers. Based on a computer simulation where we assign a score of +0.5 if the ball falls on the right side of the peg and -0.5 if the balls falls on the left side of the peg, the frequency distributions are shown below.
Chart 3: Distribution 3,000 balls & 12 Peg Layers Source: OQFM
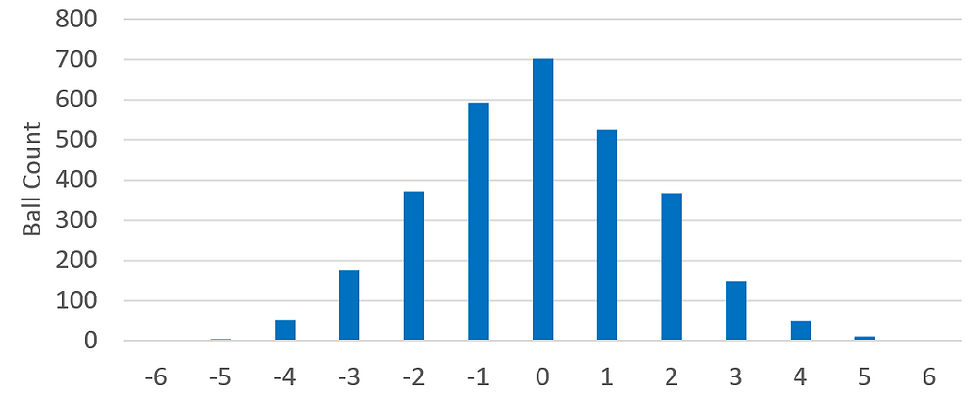
Chart 4: Distribution 3,000 balls & 200 Peg Layers Source: OQFM
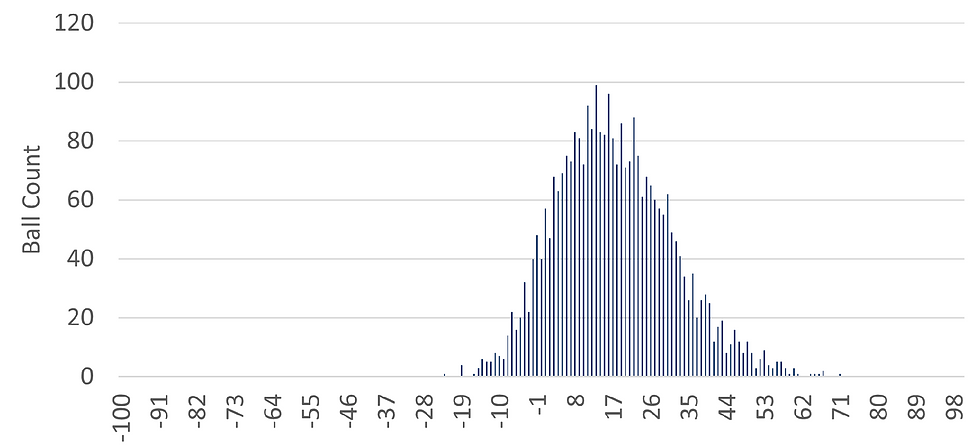
Next, we adjust our hypothetical Galton board so that we’re no longer dealing with a 50/50 scenario. More specifically, if a ball falls on the right side of the peg twice in a row it gets a score of +2, rather than 0.5. The following chart shows the frequency distribution.
Chart 5: Skewed Distribution 3,000 balls & 200 Peg Layers
Source: OQFM
This is similar to what we aim to achieve with our systematic quant factor investment process. The distributions for our hypothetical biased Galton board and the rank IC of our multi-factor quant factor are similar in that they have a positive skew and there are far more right tail outliers than left tail outliers.
Unfortunately, transaction costs and other friction costs such as stock borrow fees and financing charges can make it difficult to achieve the same positive return skew. This is where our non-systematic overlay can help. By addressing potential deficiencies in our systematic stock selection process via our micro non-systematic overlay and adjusting our investment process so that it is better suited to the current market environment via our macro non-systematic overlay, we can generate a more favourable return distribution.
In other words, we can generate an after-cost returndistribution like the one shown in Chart 5: a return distribution with a nice positive skew and very few left tail outliers. This is what we aim to achieve, and it is pleasing that we have succeeded in this endeavour since we launched the fund.
Comments